EB-5 visas for Indian investors increased more than three times. EB-5 program statistics in 2018.
The U.S. Department of State recently published the Report of the Visa Office for the 2018 fiscal year. The report indicates the number of visas issued for the EB-5 program by country.
The statistics indicate that the number of EB-5 visas being issued to applicants other than those from Mainland China grew significantly in the past year. While visas for investors from Mainland China still dominate in number, their percentage of total visas for the year has dramatically decreased.
On the other hand, the number of issued visas in other top countries increased. The number of Indian EB-5 investors has been growing steadily for the past ten years, and it may soon exceed the number of Vietnamese EB-5 investors, who take the second place in the list of the top EB-5 countries in the world. Indian investors made the most significant leap from only 1.7% of the total visas in FY 2017. Indian EB-5 visas increased more than three times to 6.1% in FY 2018.
|
Country |
FY 2017 |
FY 2017 |
FY 2018 |
FY 2018 |
|---|---|---|---|---|
|
China (mainland born) |
7,567 |
75.0% |
4,642 |
48.3% |
|
Vietnam |
471 |
4.7% |
693 |
7.2% |
|
India |
174 |
1.7% |
585 |
6.1% |
|
Korea, South |
195 |
1.9% |
531 |
5.5% |
|
China (Taiwan born) |
188 |
1.9% |
452 |
4.7% |
|
Brazil |
282 |
2.8% |
388 |
4.0% |
|
Venezuela |
108 |
1.1% |
237 |
2.5% |
|
Hong Kong S.A.R. |
81 |
0.8% |
200 |
2.1% |
|
Mexico |
85 |
0.8% |
174 |
1.8% |
|
Russia |
115 |
1.1% |
134 |
1.4% |
|
Nigeria |
89 |
0.9% |
113 |
1.2% |
|
Canada |
55 |
0.5% |
109 |
1.1% |
|
Pakistan |
22 |
0.2% |
103 |
1.1% |
|
South Africa |
53 |
0.5% |
91 |
0.9% |
|
Great Britain and territories |
82 |
0.8% |
84 |
0.9% |
The report helps to identify the next potentially significant EB-5 markets. Even though the numbers of issued visas from Mainland China still take a strong leadership position, the popularity of the EB-5 program in Vietnam, India, and other top countries is growing at a high rate.
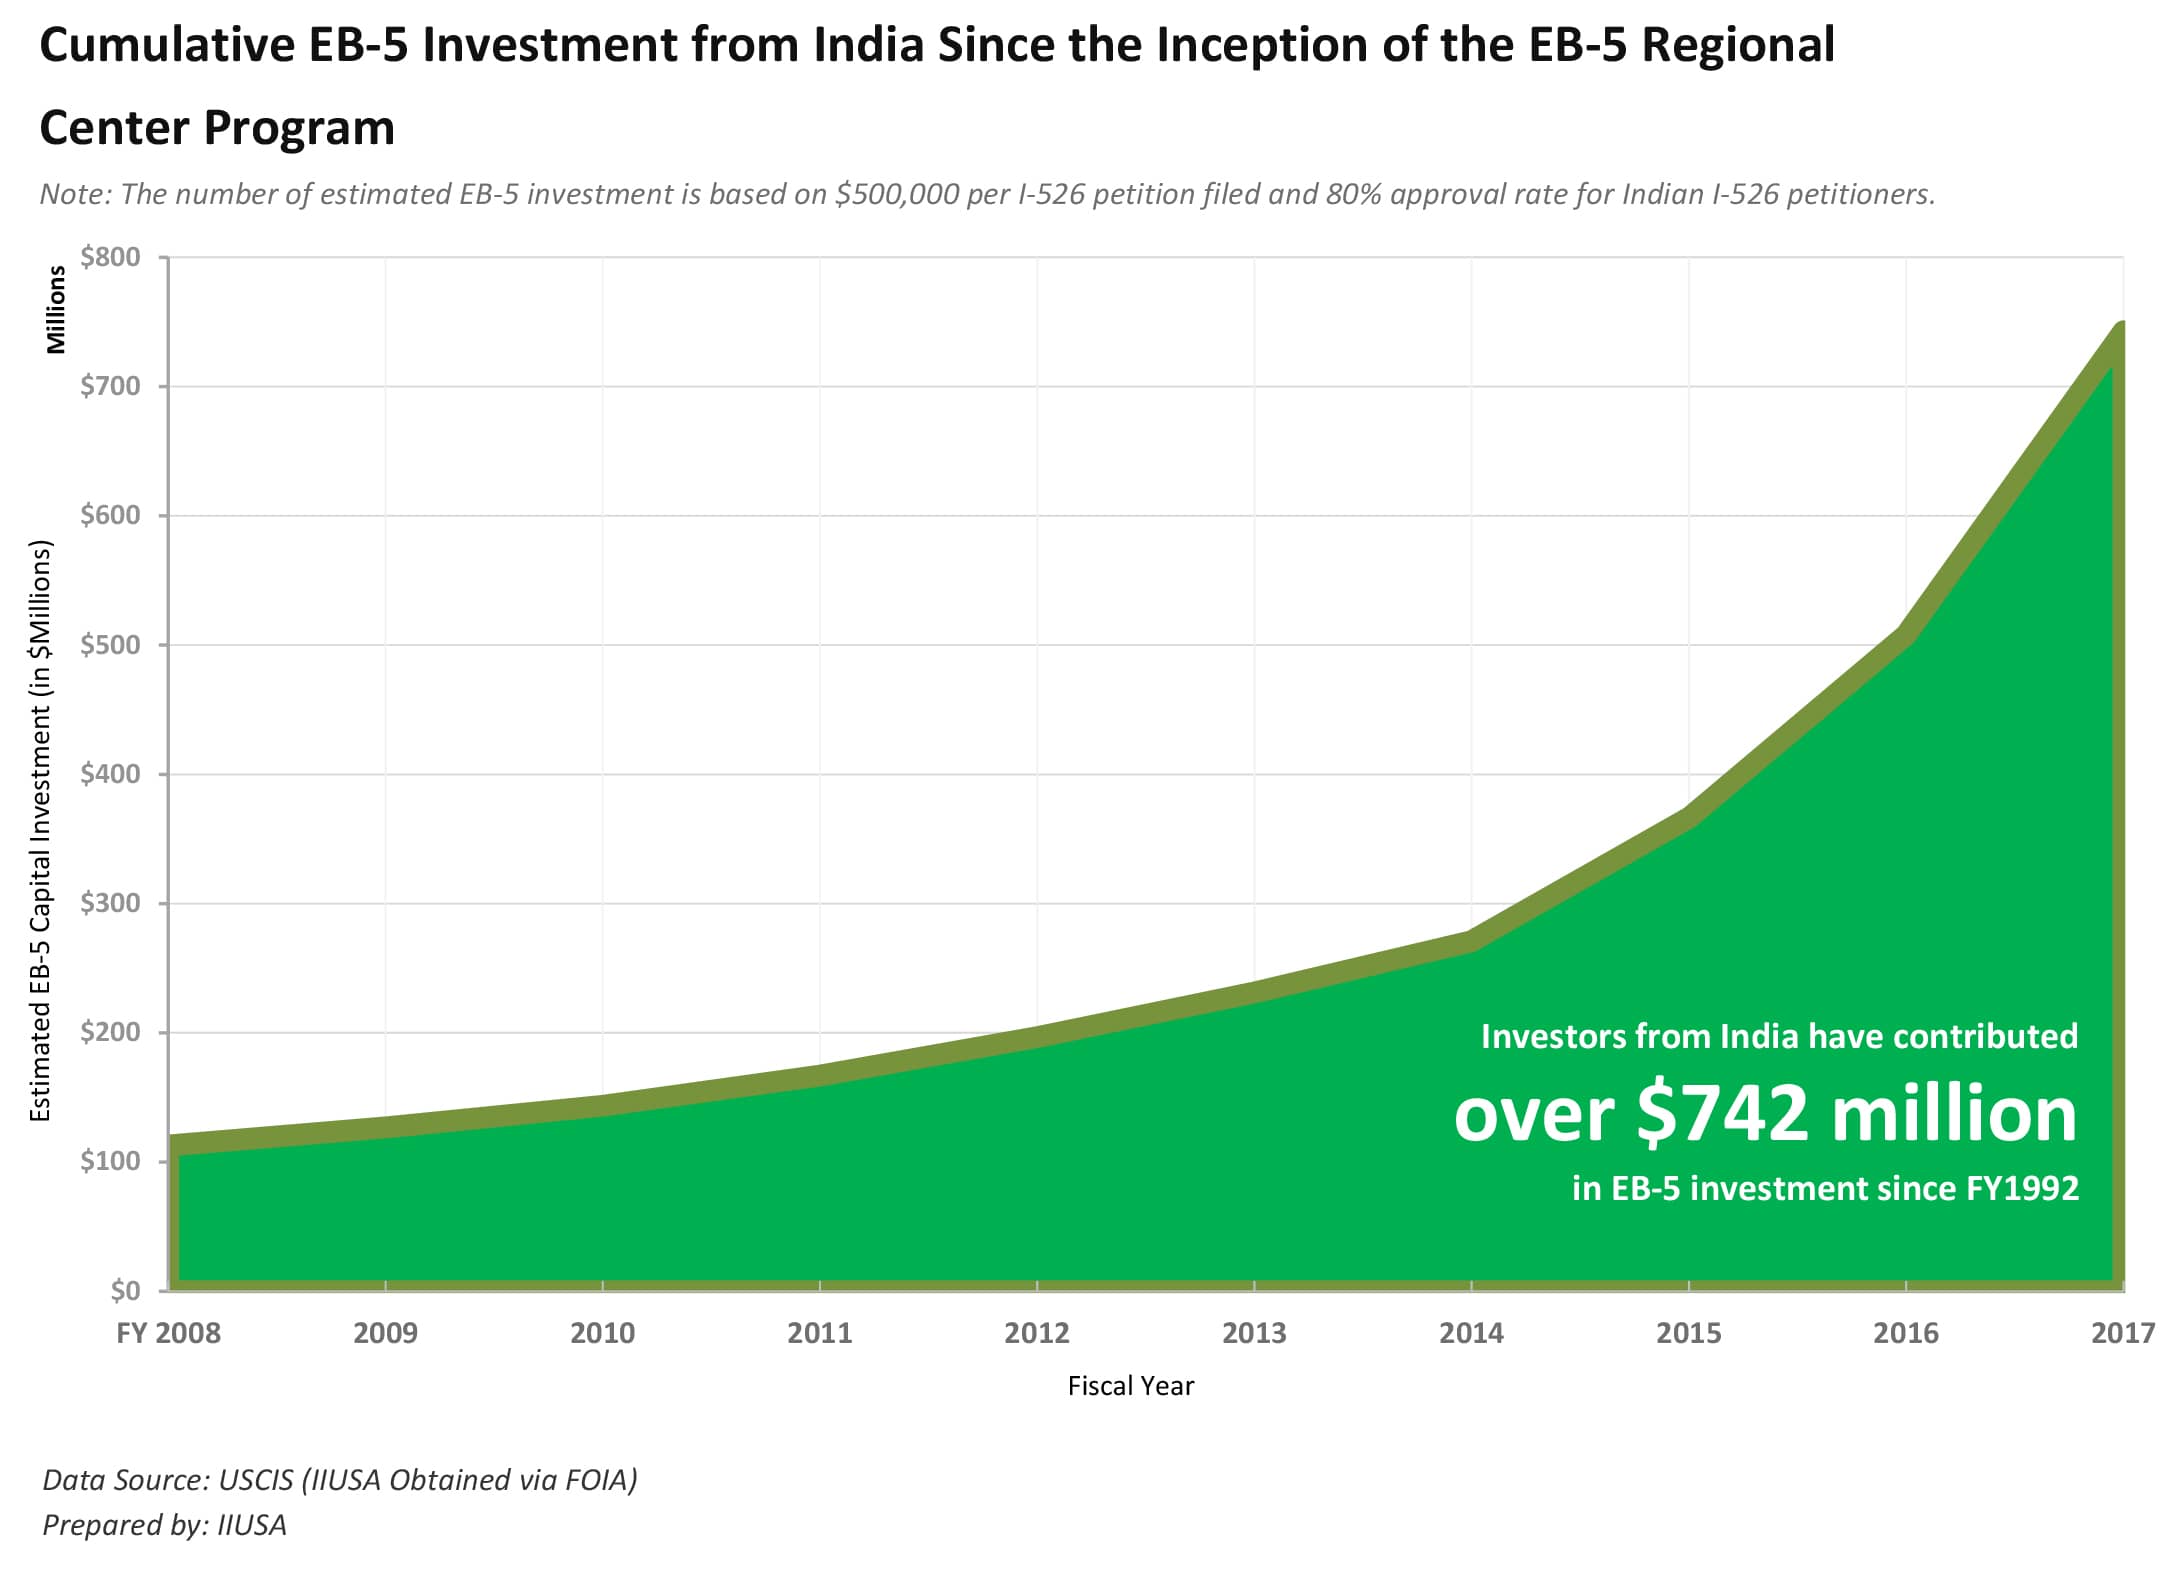
According to IIUSA’s report “EB-5 Investor Market Analysis: India & the United Arab Emirates,”
Since the inception of the EB‐5 Regional Center Program in FY 1992, nearly 1,860 Indian investors have submitted their I‐526 petition to USCIS and invested in a variety of EB‐5 projects across the United States. They have contributed over $742 million in foreign direct investment to the U.S. economy. In FY2017 alone, IIUSA estimates that approximately $235 million EB‐5 funding was generated by the investors from India, a 66% growth over FY2016.
 The United States attracts internationals seeking a better quality of life, a stable economy, more work and business opportunities, and a world-class education for their children.
The experienced American Corporate Services Law Offices, Inc. immigration attorneys will be happy to assist you in applying for an EB-5 investor visa.
Securities Disclaimer
This website is for informational purposes only and does not constitute an offer or solicitation to sell shares or securities. Any such offer or solicitation will be made only by means of an investment's confidential Offering Memorandum and in accordance with the terms of all applicable securities and other laws. This website does not constitute or form part of, and should not be construed as, any offer for sale or subscription of, or any invitation to offer to buy or subscribe for, any securities, nor should it or any part of it form the basis of, or be relied on in any connection with, any contract or commitment whatsoever. EB5Projects.com LLC and its affiliates expressly disclaim any and all responsibility for any direct or consequential loss or damage of any kind whatsoever arising directly or indirectly from: (i) reliance on any information contained in the website, (ii) any error, omission or inaccuracy in any such information or (iii) any action resulting therefrom.


