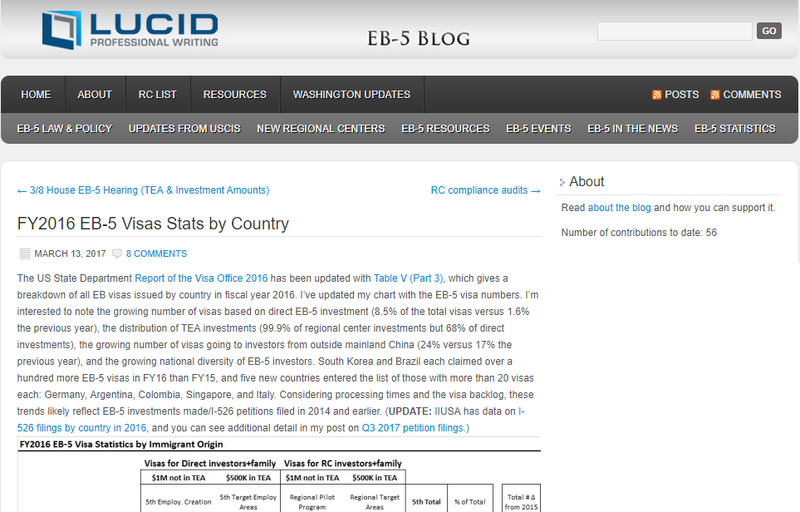
The US State Department Report of the Visa Office 2016 has been updated with Table V (Part 3), which gives a breakdown of all EB visas issued by country in fiscal year 2016. I’ve updated my chart with the EB-5 visa numbers. I’m interested to note the growing number of visas based on direct EB-5 investment (8.5% of the total visas versus 1.6% the previous year), the distribution of TEA investments (99.9% of regional center investments but 68% of direct investments), the growing number of visas going to investors from outside mainland China (24% versus 17% the previous year), and the growing national diversity of EB-5 investors.
https://blog.lucidtext.com/2017/03/13/fy2016-eb-5-visas-stats-by-country/
Mentions
States
- Washington

Securities Disclaimer
This website is for informational purposes only and does not constitute an offer or solicitation to sell shares or securities. Any such offer or solicitation will be made only by means of an investment's confidential Offering Memorandum and in accordance with the terms of all applicable securities and other laws. This website does not constitute or form part of, and should not be construed as, any offer for sale or subscription of, or any invitation to offer to buy or subscribe for, any securities, nor should it or any part of it form the basis of, or be relied on in any connection with, any contract or commitment whatsoever. EB5Projects.com LLC and its affiliates expressly disclaim any and all responsibility for any direct or consequential loss or damage of any kind whatsoever arising directly or indirectly from: (i) reliance on any information contained in the website, (ii) any error, omission or inaccuracy in any such information or (iii) any action resulting therefrom.