RCBJ Retrospective: Six Data Points Show EB-5 Has Never Been Stronger
Six Data Points Show EB-5 Has Never Been Stronger
2015 has been a big year for the EB-5 Regional Center Program (the Program). Not only has the Program become a matured economic development engine generating over $1 billion foreign direct investment (FDI) to the U.S. economy per quarter, but has also experienced an unprecedented increase in I-829 approval rates, proving the Program to be an effective financing tool that creates American jobs and provides an opportunity for foreign entrepreneurs to realize the American dream.
Data on EB-5 adjudications from U.S. Citizenship & Immigration Services (USCIS) as well as the preliminary EB-5 visa usage statistics from U.S. Department of State (DOS) for FY2015 brings to light valuable data points that illustrate the Program’s latest economic impact and adjudication trends that all EB-5 industry stakeholders should be aware of. The six data points below tell a compelling story about how the Program has never been stronger than the past fiscal year (FY) of 2015.
$4.378 Billion FDI Generated by the EB-5 Program in One Year
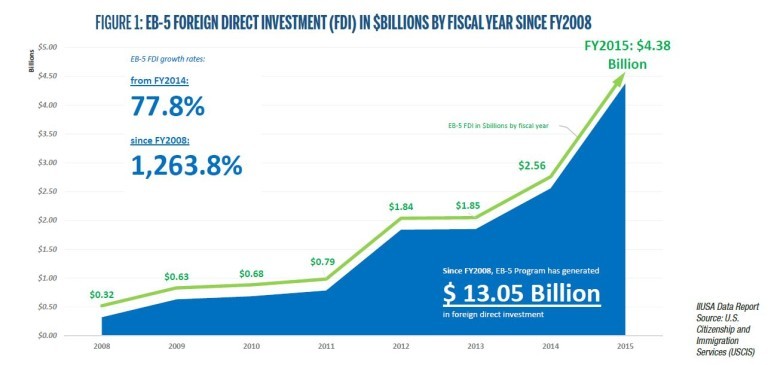
In FY2015, more than 8,700 I-526 petitions were approved by USCIS, accounting for over $4.378 billion in FDI. With a 77.8% increase from the last year, FY2015 is the first year that the Program has shown its capability to attract over $1 billion in capital investment per quarter, catalyzing local economic development across U.S. communities. That is almost $12 million in FDI every single day in FY2015. Since the Great Recession, the Program has blossomed from $3.2 million in FY2008 to over $4.3 billion in FY2015, experiencing over 1,260% growth and attracting a total of over $13.05 billion in capital investment to the U.S in the past seven years.
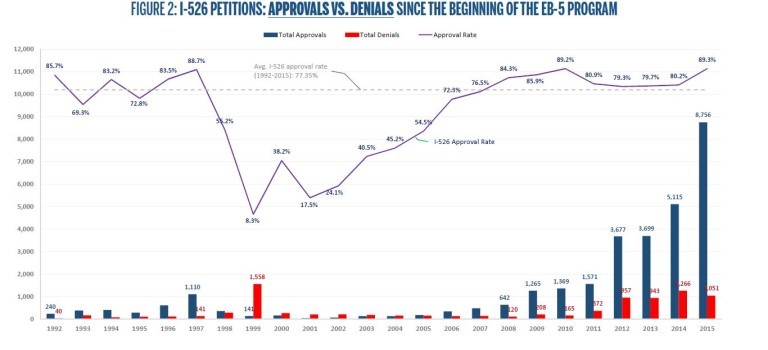
As Figure 2 shows, the average I-526 approval rate in FY2015 is over 89%, which is the highest level since the establishment of the Program. This increased I-526 approval rate not only indicates the Program is attracting an increasing amount of qualified foreign investors who are investing an approved job-creating business in U.S., but also implies that the EB-5 industry in general is becoming more educated on USCIS’s EB-5 adjudication requirements and in turn doing a better job on EB-5 compliance.
Historical High I-526 Receipts and Pending Applications
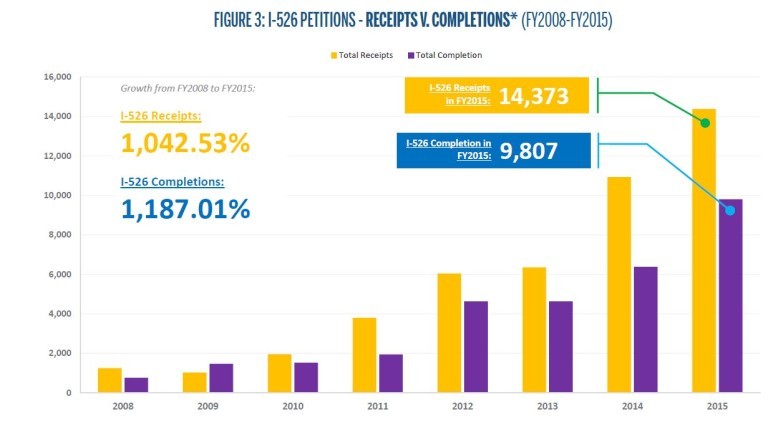
In FY2015 the number of I-526 petitions received by USCIS has continued to break records for the sixth consecutive year, showing that the demand for EB-5 is stronger than ever. As the Program faced reauthorization this year, over 14,370 EB-5 investors (6,575 in the 4th quarter) filed their I-526 petition to USCIS, a 31% increase from FY2014. The increasing amount of I-526 filings speaks to the Program’s robust demands and future growth. It also indicates a need for reform that will ensure the Program is able to utilize the increasing amount of capital investment in order to help stimulate the U.S. economy and to protect the EB-5 investors who have invested their wealth in America.
On the other side of the equation, USCIS has adjudicated (either approved or denied) a total of over 9,800 I-526 petitions in FY2015. The number of I-526 completions has increased by 54% from FY2014 and an outstanding 1,187% from FY2008. Figure 3 compares the number of I-526 receipts with I-526 competitions, which illuminates the trend of the increasing EB-5 demands as well as the progress of USCIS’s commitment to expand its capacity to adjudicate I-526 filings.
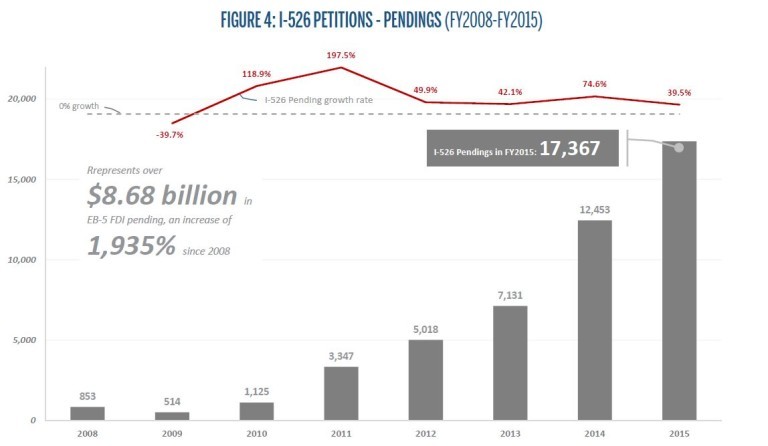
However, by the end of FY2015, there were still over 17,360 I-526 petitions pending and awaiting processing by USCIS which represents over $8.68 billion in capital investment that is waiting to be injected into the projects that promote economic development in U.S. Although the number of I-526 pending has grown over 1,900% since FY2008, its growth rate in FY2015 from FY2014 was just around 40%, the lowest level in the past five years. Based on the volume of I-526 petitions that USCIS has adjudicated in FY2015, it would take up to 21 months to process the current backlog of the I-526 filings.
I-829 Receipts and Approvals Rate in Unprecedented High
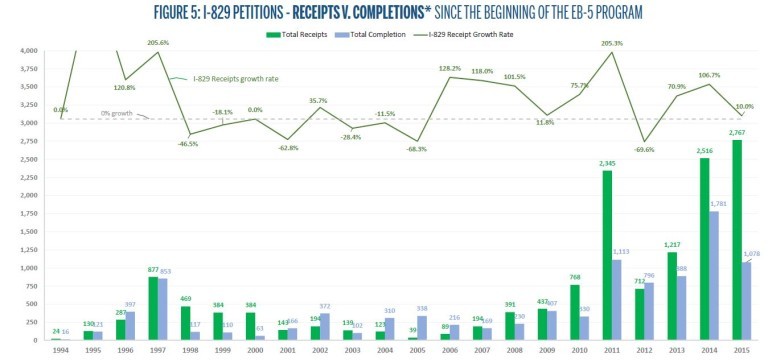
A total of 2,767 I-829 petitions were filed to USCIS in FY2015, a modest growth of 10% from FY2014. However, the unprecedented volume of I-829 petitions that USCIS has received within the past fiscal year indicate an increasing amount of EB-5 investment is delivering its promise of creating American jobs, as well as helping foreign qualified investors to realize their American dreams of moving to the United States with their loved ones.
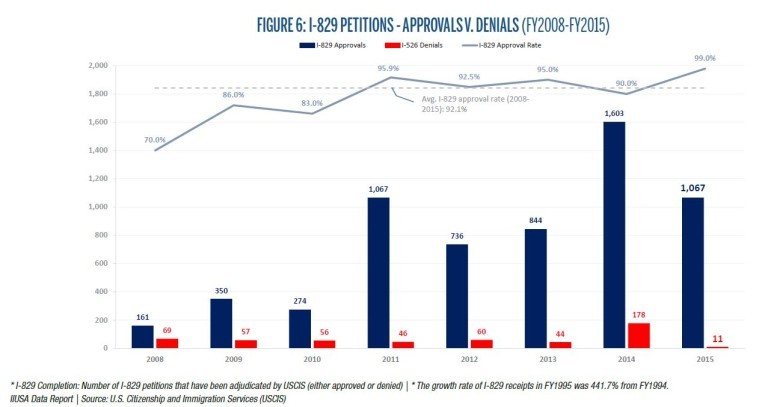
Furthermore, the average approval rate of I-829 petitions since FY2008 is over 92% (showed in Figure 6). Particularly, the I-829 approval rate in FY2015 is a recording breaking 99%. The high approval rates for I-829 petitions evidence that the Program is creating actual economic impact both according to industry economists as well as the EB-5 adjudicators from USCIS.
Preliminary Data Shows EB-5 Visa Usages in FY2015 Continues Reaching the 10,000 Visa Cap
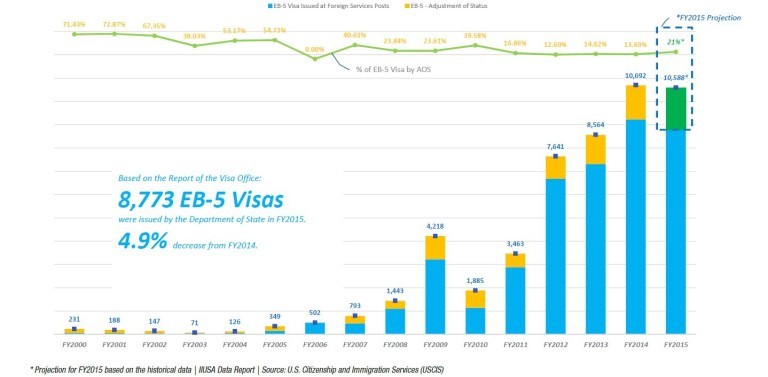
Based on the latest report from the Visa Office, a total of 8,773 EB-5 visas have been issued in FY2015 through overseas consulate offices, a 4.9% decrease from FY2014. At the time this article was written, DOS just published the preliminary statistics about immigrant visas issued at the foreign consulate offices in FY2015, excluding the visa usage through adjustment of status (AOS).
However, based on the historical EB-5 visa usage data, 21% of the EB-5 visas were used by the petitioners through AOS from FY2008 to FY2014. We estimate that approximately 1,800 EB-5 visa could be allocated through AOS in FY2015, which would lead to the projection of a total of 10,500 EB-5 visas used in this fiscal year. The EB-5 visa usage continues to reach the 10,000 allocated visa cap for the second year in a row.
I-526/I-829/I-924 Processing Times Continue Increasing
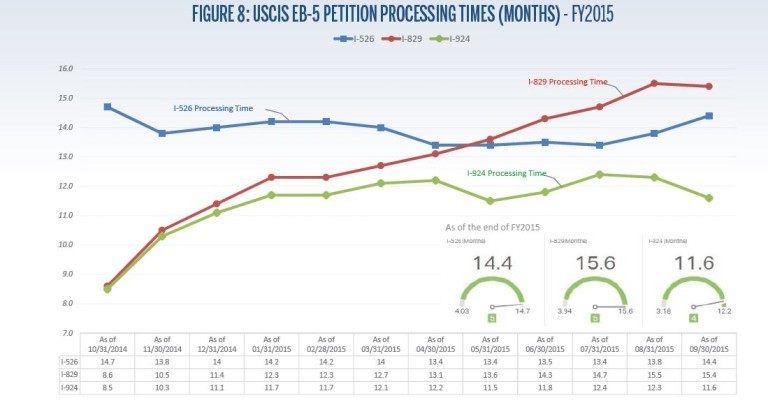
Although USCIS has committed to accelerate the adjudication for I-526, I-829, and I-924 petitions, the overall processing times for these petitions in FY2015 has remained the same length, if not longer. Particularly, I-829 processing time shows an outstanding increase from 8.6 months at the beginning of this fiscal year to over 15.4 months in the end of FY2015. As a result, USCIS only adjudicated 1,078 I-829 petitions in FY2015, a 39% decrease from FY2014.
In regards to I-526 adjudications, USCIS has showed some progress in shortening the I-526 processing time in the first three quarters of FY2015. It decreased from 14.7 months at the beginning of FY2015 to this year’s lowest level of 13.4 months in the 3rd quarter. However, it bounced back in the Q4 to over 14 months with a trend of further increases (shown in Figure 8).
The overall processing time for I-924 petitions has increased by 3 months from 8.5 months at the beginning of FY2015 to 11.6 months in the end of this fiscal year, a modest increase of 2.1 months.
Number of Regional Center Approved and Terminated
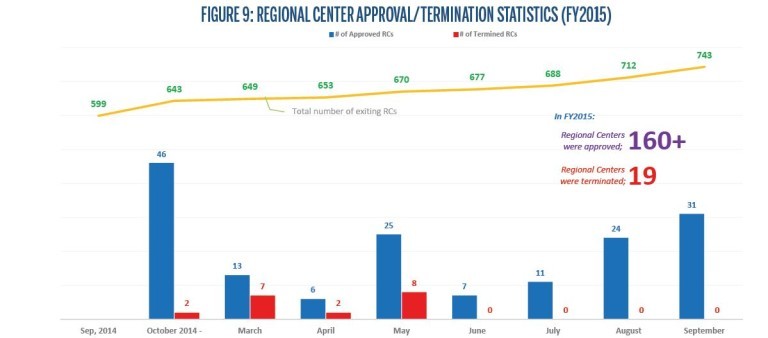
Lastly, over 160 new regional centers have been approved in FY2015, adding the total number of existing regional centers to over 740 by at the end of this fiscal year. Moreover, in FY2015 the regional center industry shows a remarkable growth of 2,421% from FY2008 when there were only 28 regional centers in the whole industry.
USCIS has started publishing the terminated regional centers on their website in FY2015. A total of 19 regional centers were terminated in this fiscal year, accounting for over half of all terminated regional centers in the Program’s lifetime.
As Figure 9 illustrates, May, August, and September were months that showed the greatest number of regional centers being approved in FY2015; while March and May were the two months with the most newly terminated regional centers.
The six data points above tell a compelling story about the Program – that it has never been stronger than it has been in FY2015 in terms of its capacity to generate FDI, demand in the global, effectiveness in creating American jobs, and in growth as an industry. The comprehensive quantitative reports of more EB-5 adjudication data in FY2015 are available to IIUSA’s members in the member portal.
https://iiusa.org/blog/research-analysis/9721/?utm_source=dlvr.it&utm_medium=twitter
Mentions
States
- Washington
Videos

Subscribe for News
Site Digest
Join Professionals on EB5Projects.com →
Securities Disclaimer
This website is for informational purposes only and does not constitute an offer or solicitation to sell shares or securities. Any such offer or solicitation will be made only by means of an investment's confidential Offering Memorandum and in accordance with the terms of all applicable securities and other laws. This website does not constitute or form part of, and should not be construed as, any offer for sale or subscription of, or any invitation to offer to buy or subscribe for, any securities, nor should it or any part of it form the basis of, or be relied on in any connection with, any contract or commitment whatsoever. EB5Projects.com LLC and its affiliates expressly disclaim any and all responsibility for any direct or consequential loss or damage of any kind whatsoever arising directly or indirectly from: (i) reliance on any information contained in the website, (ii) any error, omission or inaccuracy in any such information or (iii) any action resulting therefrom.